
Quick Start: Live ESP32 Dashboard with Local Wi-Fi & DHT11 Sensor
This step-by-step tutorial walks you through building your first live ESP32 dashboard using same-network Wi-Fi (WebSocket) and a DHT11 temperature & humidity sensor. We will start inside the WizDash app, lay out two display widgets, export the ready-to-flash .ino sketch, wire the DHT11 to your ESP32, flash the board in Arduino IDE, and return to the app to watch live temperature and humidity readings arrive.
Prerequisites
Section titled “Prerequisites”Before you begin, prepare the following hardware and software:
- 1 × ESP32 development board: This guide uses the standard ESP32-DevKitC (38-Pin, ESP32-WROOM-32) as the pinout reference; ESP32-S3 or ESP32-C3 boards also work (simply select the matching board model when flashing).
- 1 × DHT11 temperature & humidity sensor: A 3-Pin PCB breakout module (with a built-in
10kΩpull-up resistor) and 3 female-to-female jumper wires are recommended. If you are using a 4-pin bare DHT11 component, you will also need a4.7kΩ–10kΩresistor. - 1 × USB data cable: To connect your ESP32 to your computer (make sure it is a data-capable cable, not a power-only charging cable).
- A 2.4 GHz Wi-Fi local network: The ESP32 supports 2.4 GHz Wi-Fi only (not 5 GHz-only networks), and your phone and ESP32 must be on the same local network (avoid guest networks with AP / client isolation enabled).
- Arduino IDE 2.x installed on your computer: With the
esp32 by Espressif Systemsboard package installed via Boards Manager.
Step 1: Create Your First Project and Open the Project Menu
Section titled “Step 1: Create Your First Project and Open the Project Menu”- On the Projects screen, tap ”+ New Project” and enter DHT11 Climate Monitor. WizDash opens Connection Settings automatically; continue with Step 2.
- The free version includes 1 project and up to 10 functional widgets per project (Icon and Spacer layout elements do not count toward the limit).
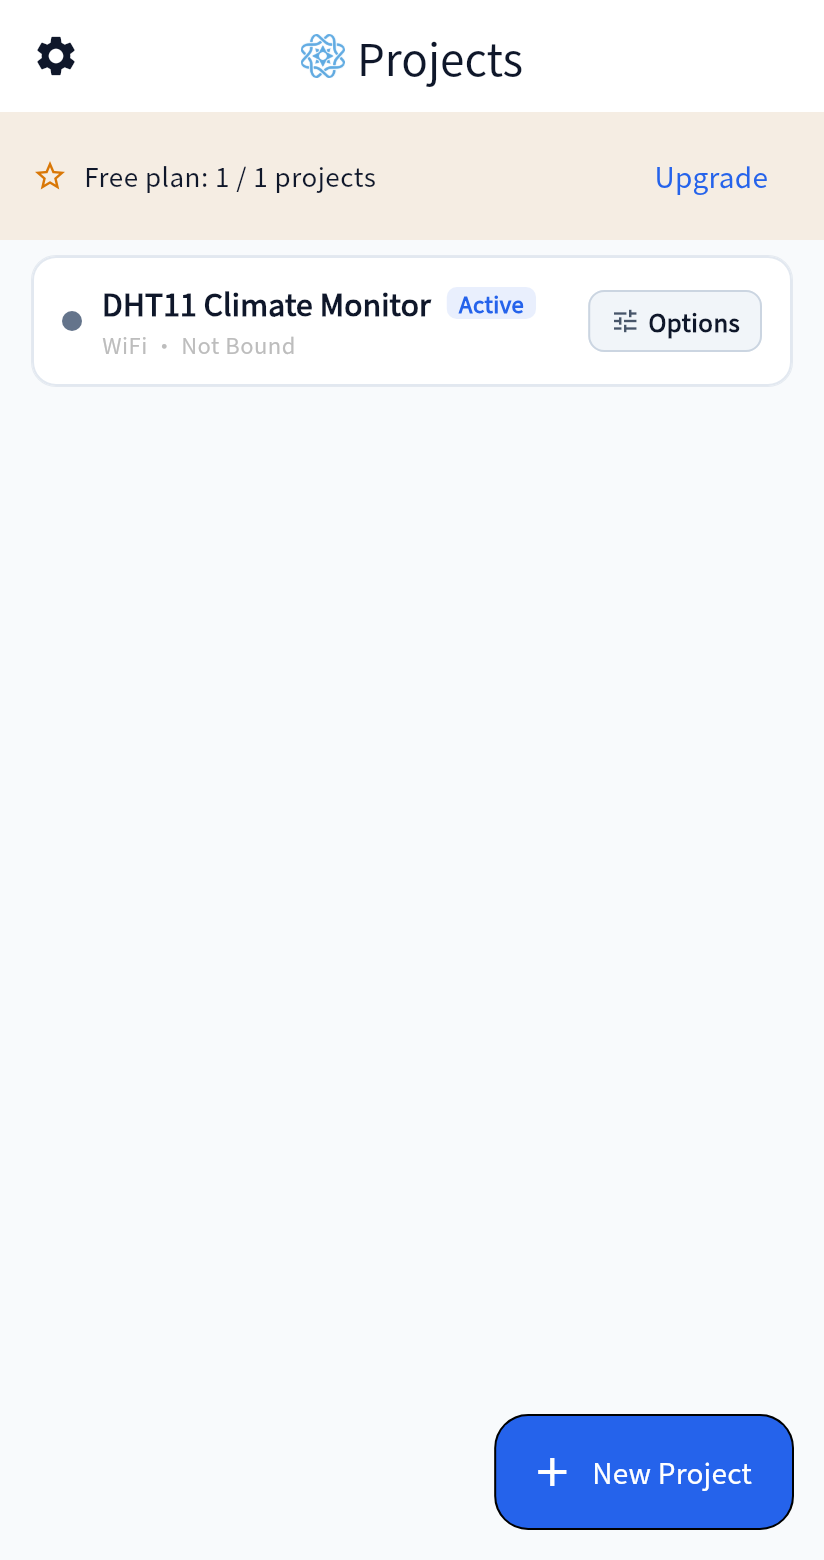
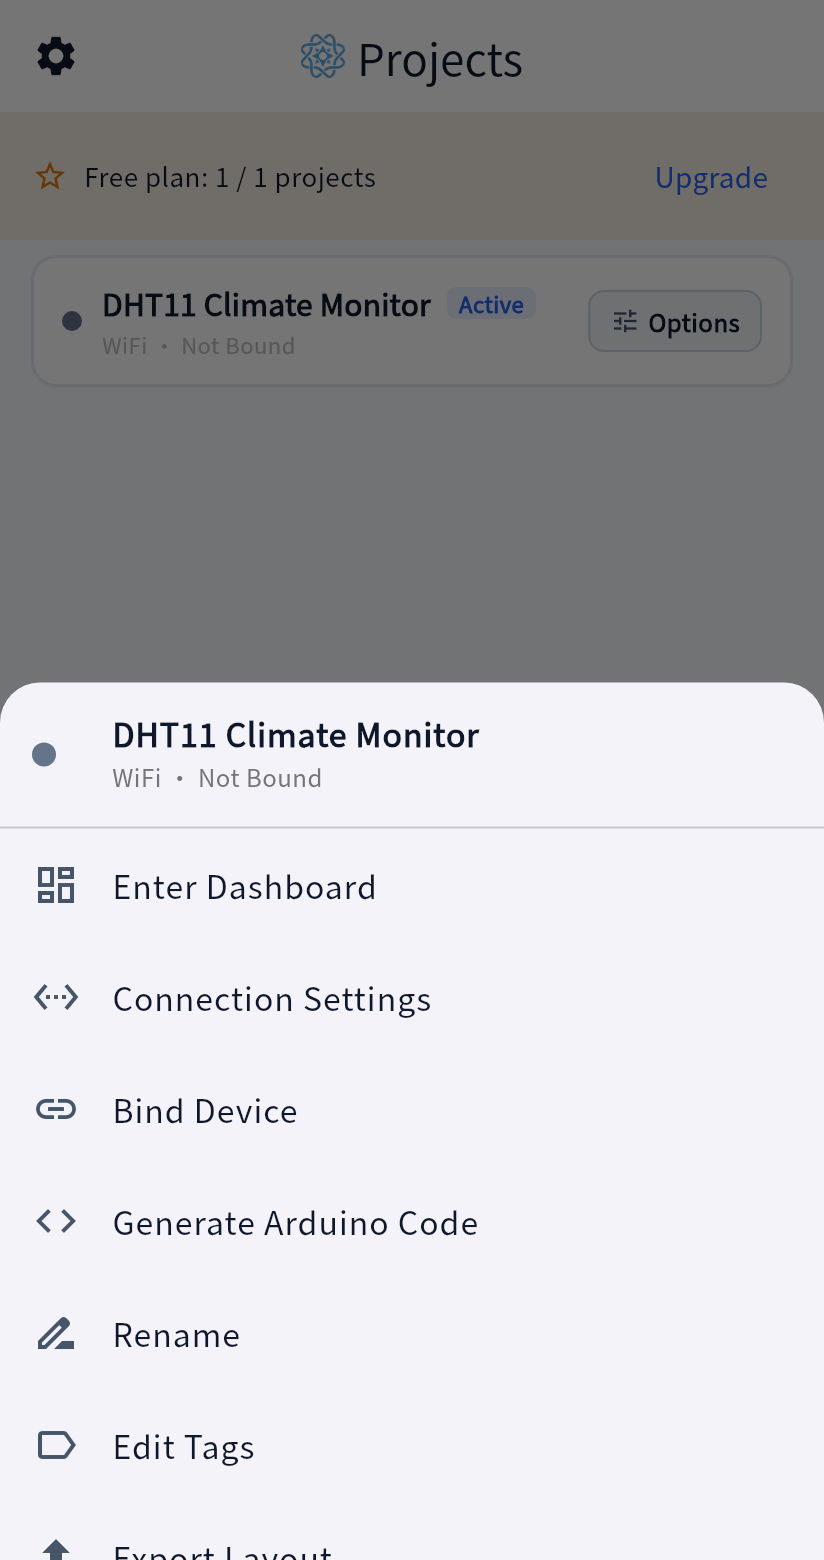
- After completing Step 2, you can return to Projects and tap “Options” (the tune icon) on the project card. The two images below show the project after Wi-Fi setup, before device binding.
Step 2: Configure Local Wi-Fi Connection Settings
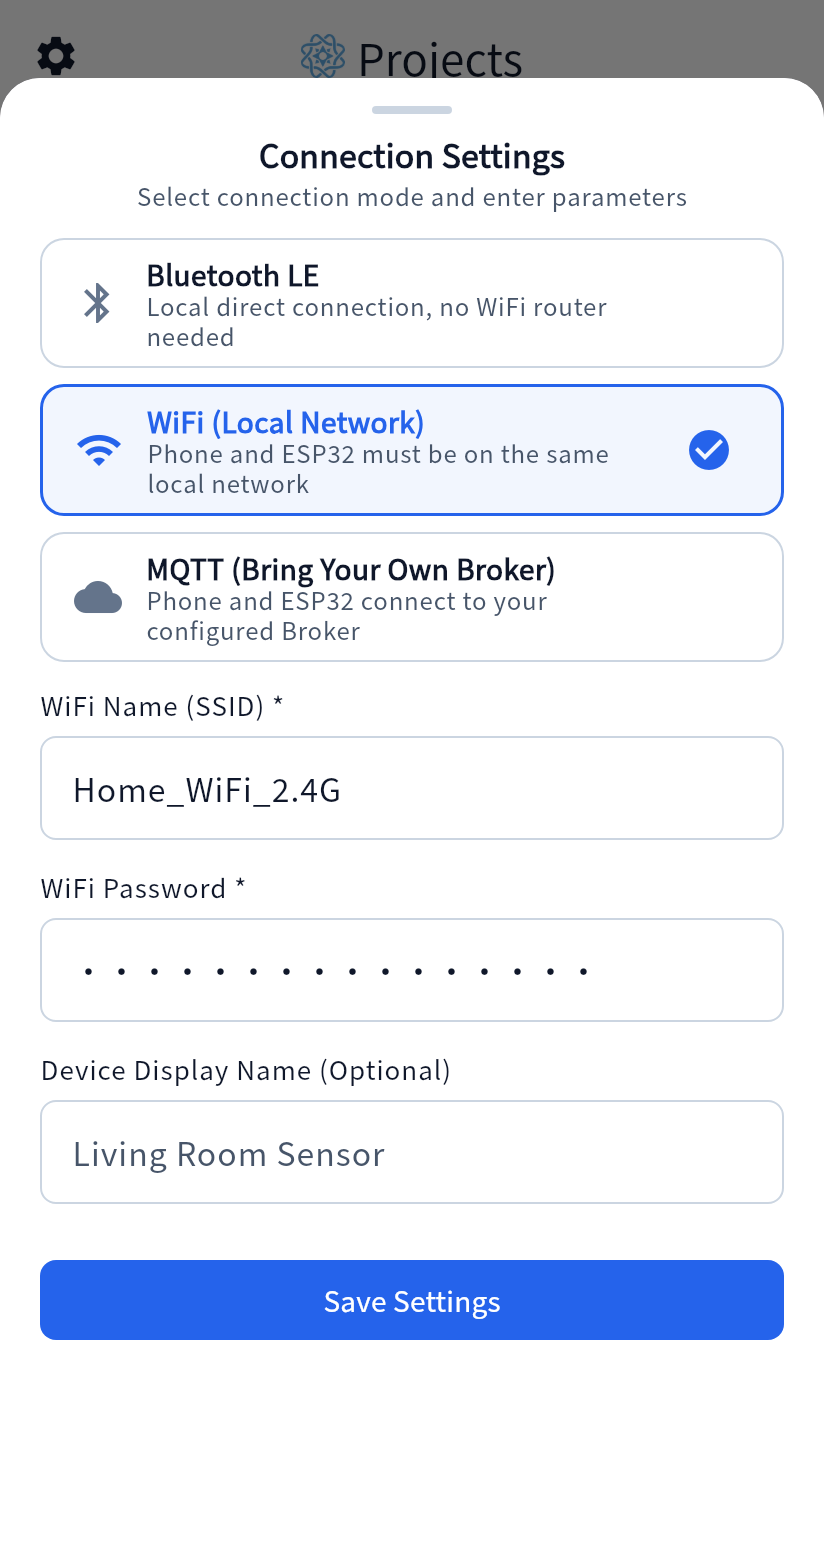
Section titled “Step 2: Configure Local Wi-Fi Connection Settings”- Connection Settings opens automatically after project creation. If you have returned to Projects, reopen it through “Options” → “Connection Settings”.
- Select the second card: “WiFi (Local Network)” (Phone and ESP32 on same network).
- Enter your 2.4 GHz Wi-Fi SSID and Wi-Fi Password (this tutorial uses
Home_WiFi_2.4Gandmy-wifi-passwordas examples), plus an optional display name. - Tap “Save Settings” at the bottom.
Why enter Wi-Fi credentials in the app first? WizDash stores these settings locally on your phone for this project. When you open Generate Arduino Code in Step 5, WizDash automatically injects your SSID and password into the
WIFI_SSIDandWIFI_PASSWORDconstants of the.inosketch so you don’t have to type them by hand.
Step 3: Enter the Dashboard and Add the Thermometer & Humidity Widgets
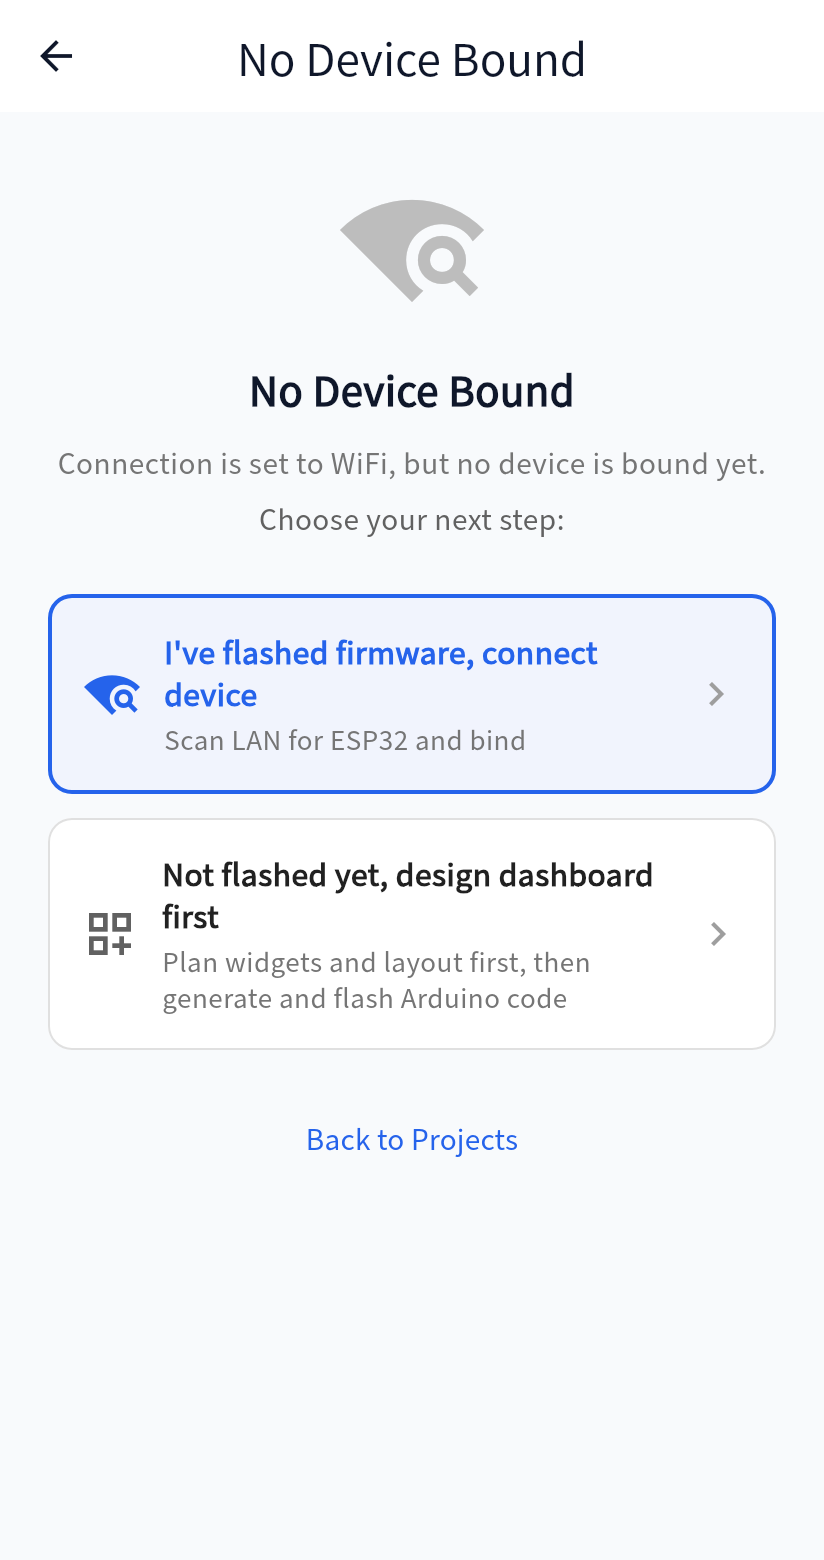
Section titled “Step 3: Enter the Dashboard and Add the Thermometer & Humidity Widgets”- After creating a project and saving its connection settings, WizDash opens the dashboard automatically. From Projects, you can also choose “Options” → “Enter Dashboard”. An unbound project displays “No Device Bound”.
- Tap the second card, “Not flashed yet, design dashboard first”, to jump straight into Edit Layout mode (indicated by the dark navy top toolbar).
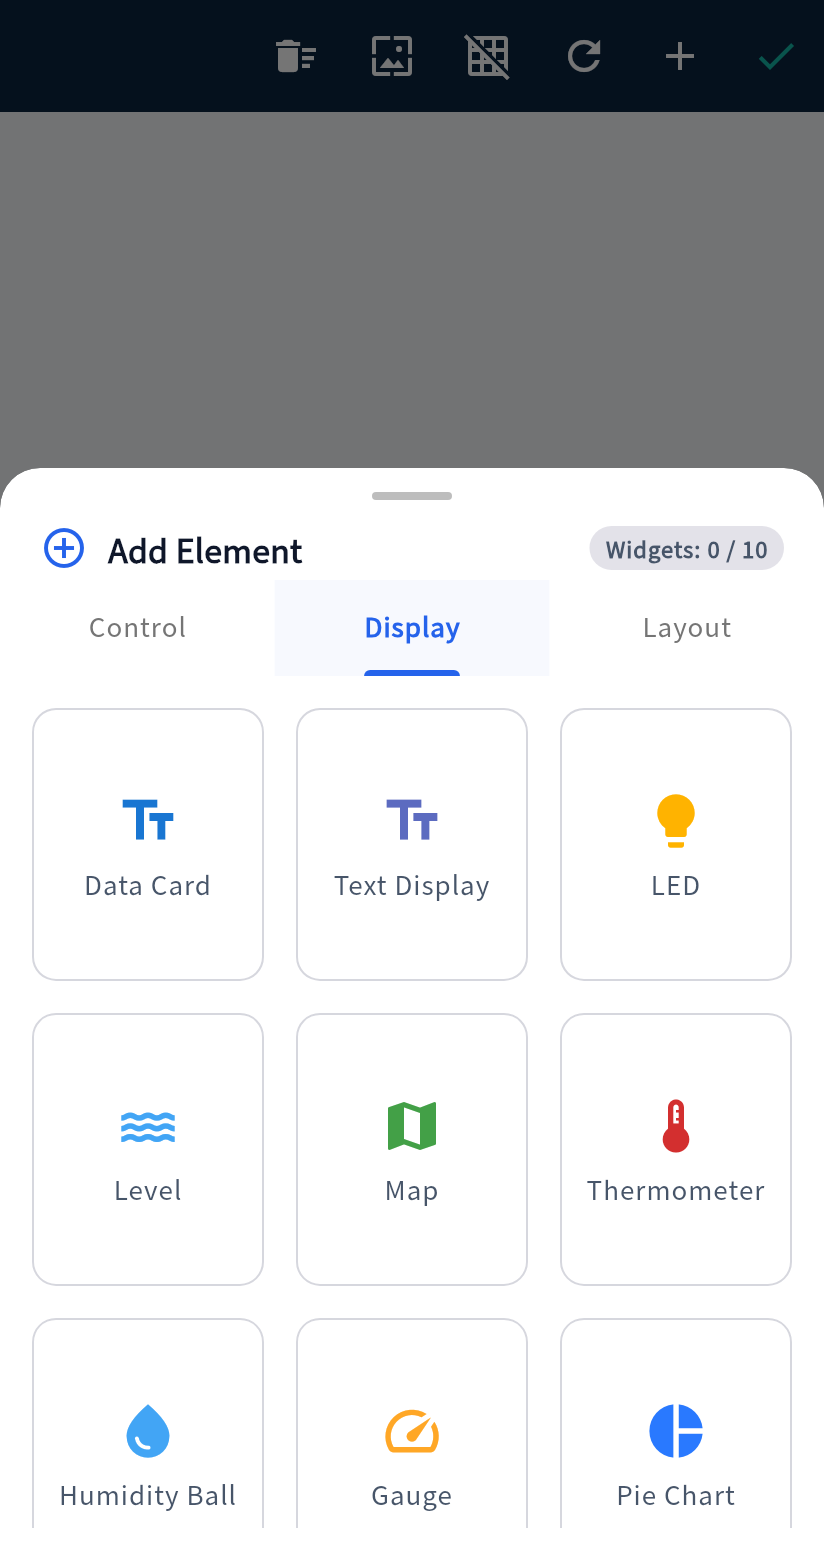
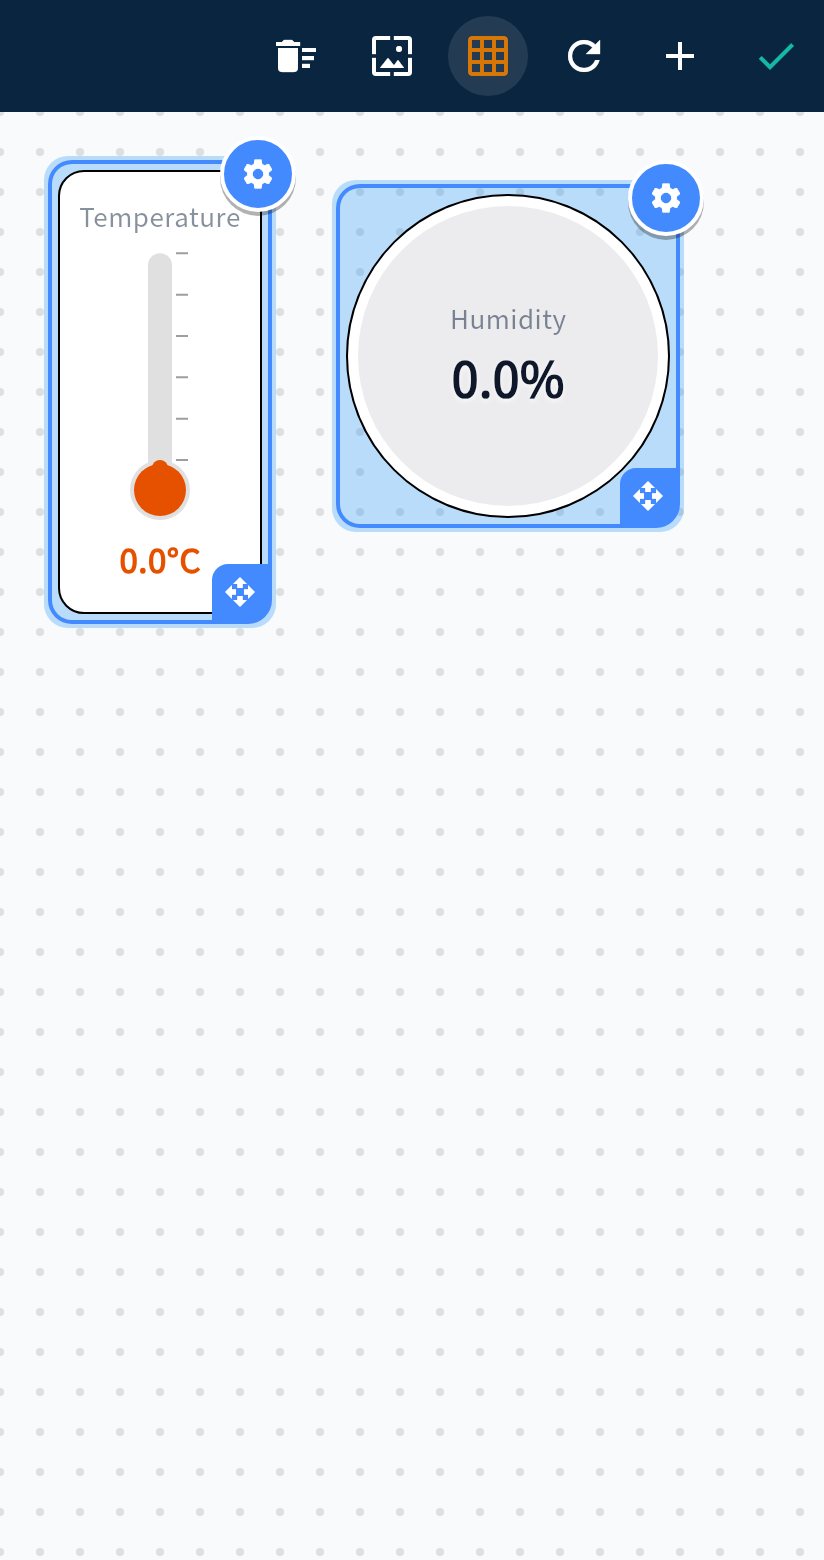
- Tap ”+”, switch to “Display”, and select “Thermometer”. The sheet closes after selection. Tap ”+” again, switch to “Display”, and select “Humidity Ball”.
- Tap the Grid icon in the top toolbar to enable grid snapping (highlighted in orange), then drag and resize the two widgets on the canvas.
Step 4: Verify Widget Titles, Units, and JSON Keys
Section titled “Step 4: Verify Widget Titles, Units, and JSON Keys”While in Edit Layout mode, tap the blue gear icon on the top-right corner of a widget (or double-tap the widget) to inspect its settings:
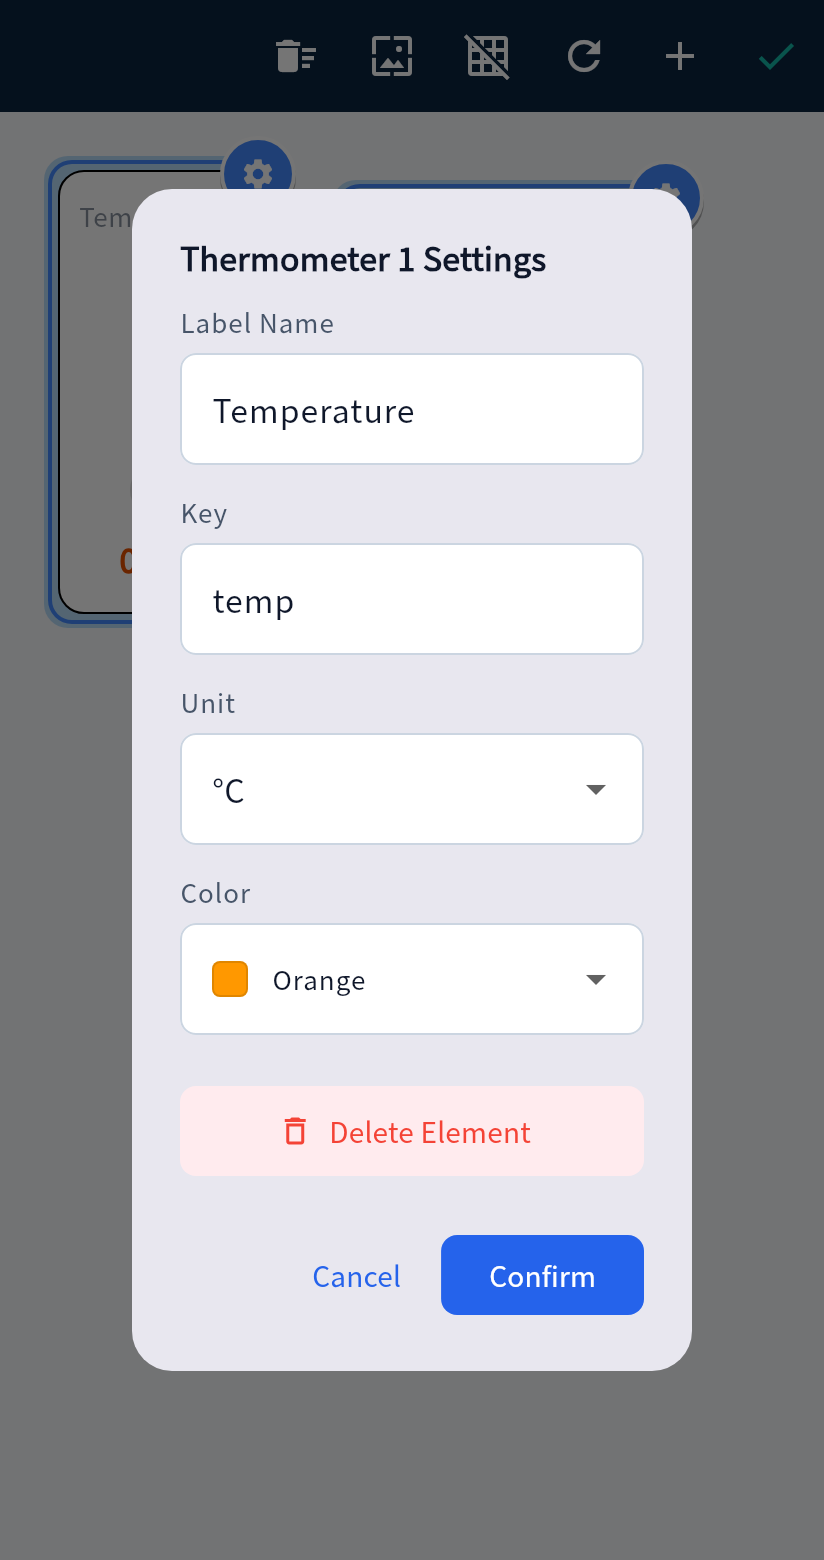
- Thermometer 1 Settings:
- Label Name:
Temperature - Key (JSON Key): Keep the default
temp(case-sensitive) - Unit:
°C - Color:
Orange, then tap Confirm.
- Label Name:
- Humidity Ball 1 Settings:
- Label Name:
Humidity - Key (JSON Key): Change the default
humitohum(case-sensitive), then tap Confirm.
- Label Name:
- Tap the green checkmark ”✓” in the top-right corner of the toolbar to save your layout, then tap the back arrow to return to the Projects screen.
| Dashboard Widget | Label | JSON Key (Case-Sensitive) | Range / Unit | DHT11 Firmware Function |
|---|---|---|---|---|
Thermometer (thermo) | Temperature | temp | °C | dht.readTemperature() |
Humidity Ball (hball) | Humidity | hum | 0–100 % | dht.readHumidity() |
Step 5: Bind DHT11 (GPIO 4) and Export the ESP32 Arduino Sketch
Section titled “Step 5: Bind DHT11 (GPIO 4) and Export the ESP32 Arduino Sketch”- Back on the Projects screen, tap “Options” → “Generate Arduino Code” on your project card.
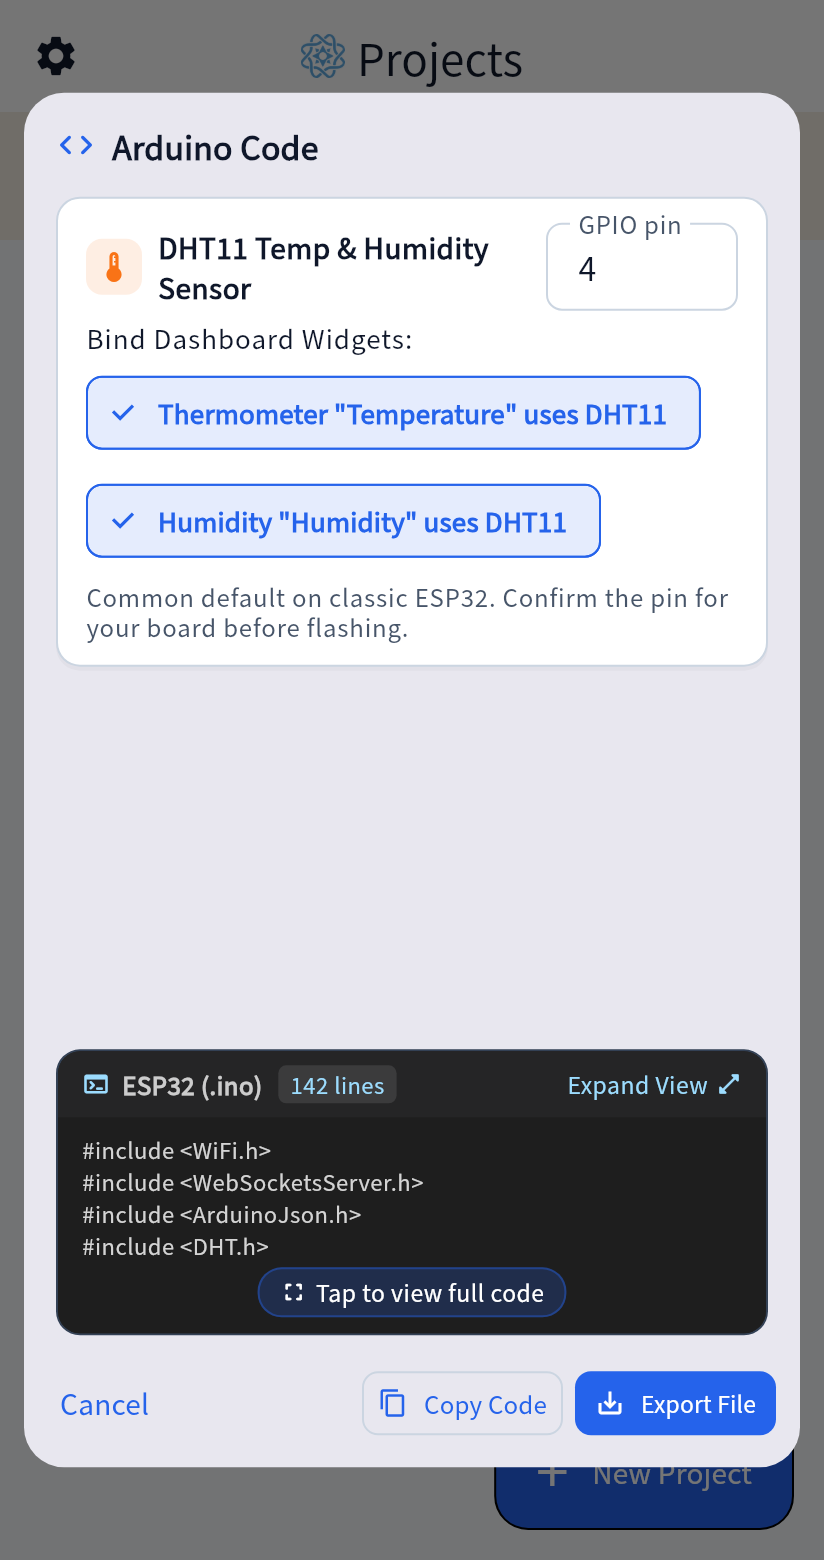
- Because your dashboard includes a thermometer and a humidity ball, the dialog automatically displays the “DHT11 Temp & Humidity Sensor” hardware binding card:
- GPIO Pin: Leave at the default
4(which connects the DHT11 data line to ESP32GPIO 4). - Bind Dashboard Widgets: Tap both filter chips so
✓ Thermometer "Temperature" uses DHT11and✓ Humidity "Humidity" uses DHT11are selected.
- GPIO Pin: Leave at the default
- Selecting both chips updates the preview with
#include <DHT.h>andreadSensors(). Tap “Expand View”, then “Export File” or “Copy Code”. Wi-Fi exports are namedWizDash_WiFi_<time-code>.ino; the viewer title always showsWizDash_ESP32.ino. Rename the exported file toWizDash_ESP32.inoto follow the filename examples below.
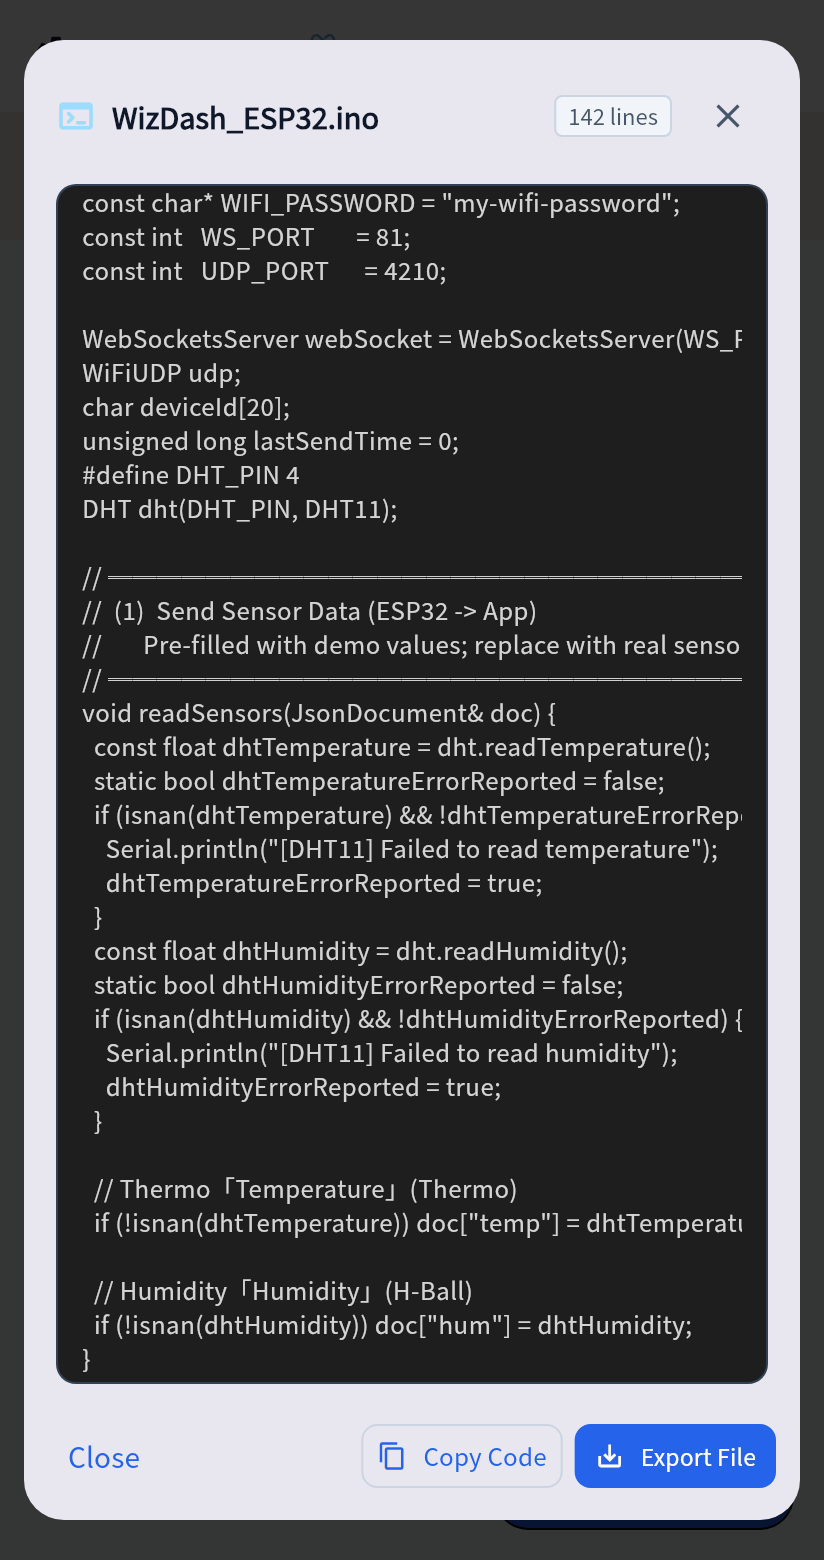
Expand the Wi-Fi + DHT11 reference sketch (comments and formatting have been edited; use the app export for the exact generated output)
/* ============================================================ *  WizDash ESP32 (WiFi LAN) — Generated by the app * *  >>> 3 steps before upload <<< *    1) Arduino IDE -> Tools -> Board -> pick the ESP32 model that matches your board *       e.g. WROOM -> ESP32 Dev Module; S3 -> ESP32S3 Dev Module; C3 -> ESP32C3 Dev Module *    2) Tools -> Manage Libraries, install: *         - WebSockets      (by Markus Sattler) *         - ArduinoJson     (by Benoit Blanchon, v7+) *         - DHT sensor library     (by Adafruit) *         - Adafruit Unified Sensor *    3) Plug in USB -> click Upload (right arrow) * ============================================================ */#include <WiFi.h>#include <WebSocketsServer.h>#include <ArduinoJson.h>#include <DHT.h>#include <ESPmDNS.h>#include <WiFiUdp.h>
// ════════════════════════════════════════════════════════════//  0  Wi-Fi settings (filled in by the app)// ════════════════════════════════════════════════════════════const char* WIFI_SSID     = "Home_WiFi_2.4G";const char* WIFI_PASSWORD = "my-wifi-password";const int   WS_PORT       = 81;const int   UDP_PORT      = 4210;
WebSocketsServer webSocket = WebSocketsServer(WS_PORT);WiFiUDP udp;char deviceId[20];unsigned long lastSendTime = 0;#define DHT_PIN 4DHT dht(DHT_PIN, DHT11);
// ════════════════════════════════════════════════════════════//  1  Send data (ESP32 -> App)// ════════════════════════════════════════════════════════════void readSensors(JsonDocument& doc) {  const float dhtTemperature = dht.readTemperature();  static bool dhtTemperatureErrorReported = false;  if (isnan(dhtTemperature) && !dhtTemperatureErrorReported) {    Serial.println("[DHT11] Failed to read temperature");    dhtTemperatureErrorReported = true;  }  const float dhtHumidity = dht.readHumidity();  static bool dhtHumidityErrorReported = false;  if (isnan(dhtHumidity) && !dhtHumidityErrorReported) {    Serial.println("[DHT11] Failed to read humidity");    dhtHumidityErrorReported = true;  }
  // Thermometer "Temperature" (Thermo)  if (!isnan(dhtTemperature)) doc["temp"] = dhtTemperature;
  // Humidity ball "Humidity" (H-Ball)  if (!isnan(dhtHumidity)) doc["hum"] = dhtHumidity;}
// ════════════════════════════════════════════════════════════//  2  Receive commands (App -> ESP32)// ════════════════════════════════════════════════════════════void onCommand(JsonDocument& doc) {  // (No control widgets found)}
// ════════════════════════════════════════════════════════════//   Framework code below — usually no changes needed// ════════════════════════════════════════════════════════════void webSocketEvent(uint8_t clientId, WStype_t type, uint8_t* payload, size_t length) {  if (type == WStype_CONNECTED) {    StaticJsonDocument<64> hs;    hs["_id"]   = deviceId;    hs["_name"] = deviceId;    String hsStr; serializeJson(hs, hsStr);    webSocket.sendTXT(clientId, hsStr);  } else if (type == WStype_TEXT) {    JsonDocument doc;    if (deserializeJson(doc, (char*)payload) == DeserializationError::Ok) {      onCommand(doc);    }  }}
void handleUdp() {  if (udp.parsePacket() == 0) return;  char buf[32] = {0};  udp.read(buf, sizeof(buf) - 1);  if (String(buf).indexOf("WIZDASH_DISCOVER") >= 0) {    String reply = "WIZDASH_HERE:" + String(WS_PORT);    udp.beginPacket(udp.remoteIP(), udp.remotePort());    udp.print(reply); udp.endPacket();  }}
void sendDataToApp() {  JsonDocument doc;  readSensors(doc);  String json; serializeJson(doc, json);  webSocket.broadcastTXT(json);}
void setup() {  Serial.begin(115200);  dht.begin();  WiFi.config(INADDR_NONE, INADDR_NONE, INADDR_NONE,             IPAddress(8, 8, 8, 8), IPAddress(8, 8, 4, 4));  WiFi.begin(WIFI_SSID, WIFI_PASSWORD);  while (WiFi.status() != WL_CONNECTED) { delay(500); Serial.print("."); }  Serial.println("\nIP: " + WiFi.localIP().toString());
  uint64_t mac = ESP.getEfuseMac();  snprintf(deviceId, sizeof(deviceId), "wizdash-%02x%02x",    (uint8_t)(mac >> 8), (uint8_t)(mac));
  MDNS.begin(deviceId);  MDNS.addService("wizdash", "tcp", WS_PORT);  udp.begin(UDP_PORT);  webSocket.begin();  webSocket.onEvent(webSocketEvent);}
void loop() {  webSocket.loop();  handleUdp();  if (millis() - lastSendTime >= 2000) {    lastSendTime = millis();    sendDataToApp();  }}
Step 6: Wire the DHT11 Sensor to Your ESP32 (GPIO 4)
Section titled “Step 6: Wire the DHT11 Sensor to Your ESP32 (GPIO 4)”Unplug the USB cable from your ESP32 before wiring. Using a standard ESP32-DevKitC (38-Pin) board and a 3-Pin DHT11 PCB module, connect the three jumper wires as shown below:
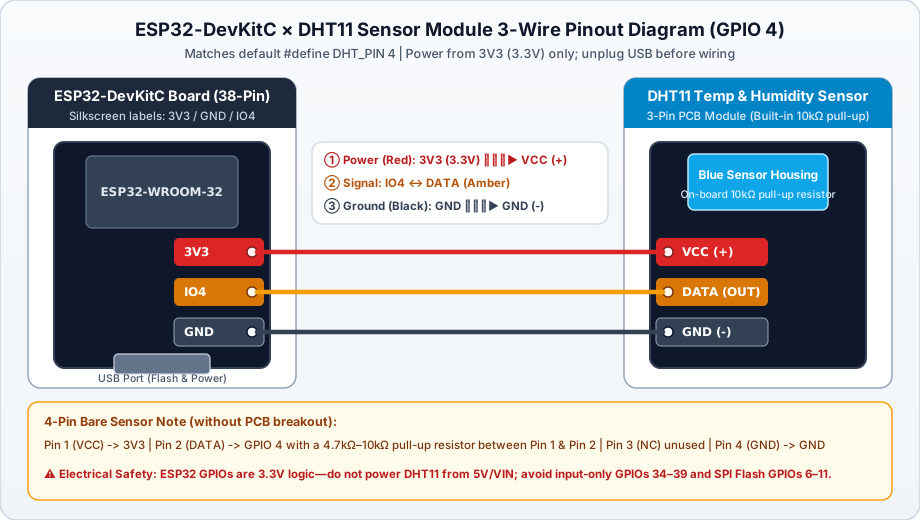
| DHT11 Module Pin | Wire Color | ESP32-DevKitC Silkscreen | Electrical & Firmware Notes |
|---|---|---|---|
VCC (or +) | Red | 3V3 (3.3V Power) | Always power from 3.3V so the data line never exceeds 3.3V GPIO logic levels |
DATA (or OUT / S) | Amber / Yellow | IO4 (GPIO 4) | Matches #define DHT_PIN 4 in the generated sketch |
GND (or -) | Black | GND (Ground) | Common ground with the ESP32 |
- 3-Pin PCB Module vs. 4-Pin Bare Sensor:
- Most 3-Pin PCB breakout modules include a built-in
10kΩpull-up resistor on the board—just connect the 3 jumper wires directly. - If you are using a 4-Pin bare blue DHT11 sensor without a breakout PCB (pins 1 to 4 from left to right facing the front grille): connect Pin 1 to
3V3, Pin 2 (DATA) toGPIO 4with a4.7kΩ–10kΩpull-up resistor bridged between Pin 1 and Pin 2, leave Pin 3 (NC) unconnected, and connect Pin 4 toGND.
- Most 3-Pin PCB breakout modules include a built-in
- Pins to avoid if you change the GPIO: Avoid input-only pins
GPIO 34–39(which lack internal pull-up resistors) and SPI Flash pinsGPIO 6–11.
Step 7: Open in Arduino IDE, Install Libraries, and Flash to ESP32
Section titled “Step 7: Open in Arduino IDE, Install Libraries, and Flash to ESP32”Plug your ESP32 into your computer via USB and complete the four steps below in Arduino IDE:
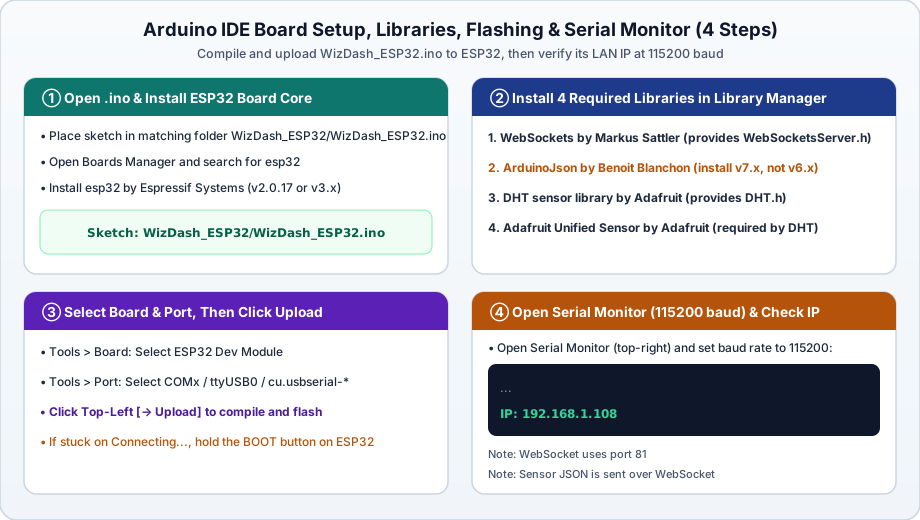
- Open the
.inoSketch & Verify the ESP32 Board Core:- Arduino IDE requires every
.inosketch to live inside a folder of the same name (e.g.,WizDash_ESP32/WizDash_ESP32.ino). When you open the exported file, let Arduino IDE create the matching folder if prompted. - If you have not installed ESP32 board support yet, open Boards Manager, search for
esp32, and installesp32 by Espressif Systems(v2.0.17 or v3.x).
- Arduino IDE requires every
- Install the 4 Required Libraries in Library Manager:
WebSocketsby Markus Sattler (provides<WebSocketsServer.h>; double-check the author name).ArduinoJsonby Benoit Blanchon (install version7.x, as the generated sketch uses the v7JsonDocumentAPI rather than 6.x).DHT sensor libraryby Adafruit (provides<DHT.h>).Adafruit Unified Sensorby Adafruit (required dependency for the DHT library; click Install All if prompted when installingDHT sensor library).
- Select Board & Port, Then Click Upload:
- Choose
Tools > Board > esp32 > ESP32 Dev Module(or the matching S3/C3 board entry). - Choose
Tools > Portand select your ESP32 serial port (COMxon Windows,/dev/ttyUSB0or/dev/ttyACM0on Linux,/dev/cu.usbserial-*on macOS). - Click the
→ Uploadbutton in the top-left corner. If the console stays onConnecting........, hold down theBOOTbutton on your ESP32 for 1–2 seconds until upload percentages appear.
- Choose
- Verify the ESP32 IP Address in Serial Monitor (
115200 baud):- Open Serial Monitor (top-right magnifying glass icon) and set the baud rate to
115200. - Press the
EN(orRST) button on your ESP32. Once it joins your Wi-Fi network, it prints its local IP address (for example,IP: 192.168.1.108), starts the WebSocket server on port81, and begins broadcasting DHT11 readings every 2 seconds.
- Open Serial Monitor (top-right magnifying glass icon) and set the baud rate to
Step 8: Return to WizDash and Connect to Your ESP32
Section titled “Step 8: Return to WizDash and Connect to Your ESP32”- Make sure your phone is connected to the same 2.4 GHz Wi-Fi network as your ESP32.
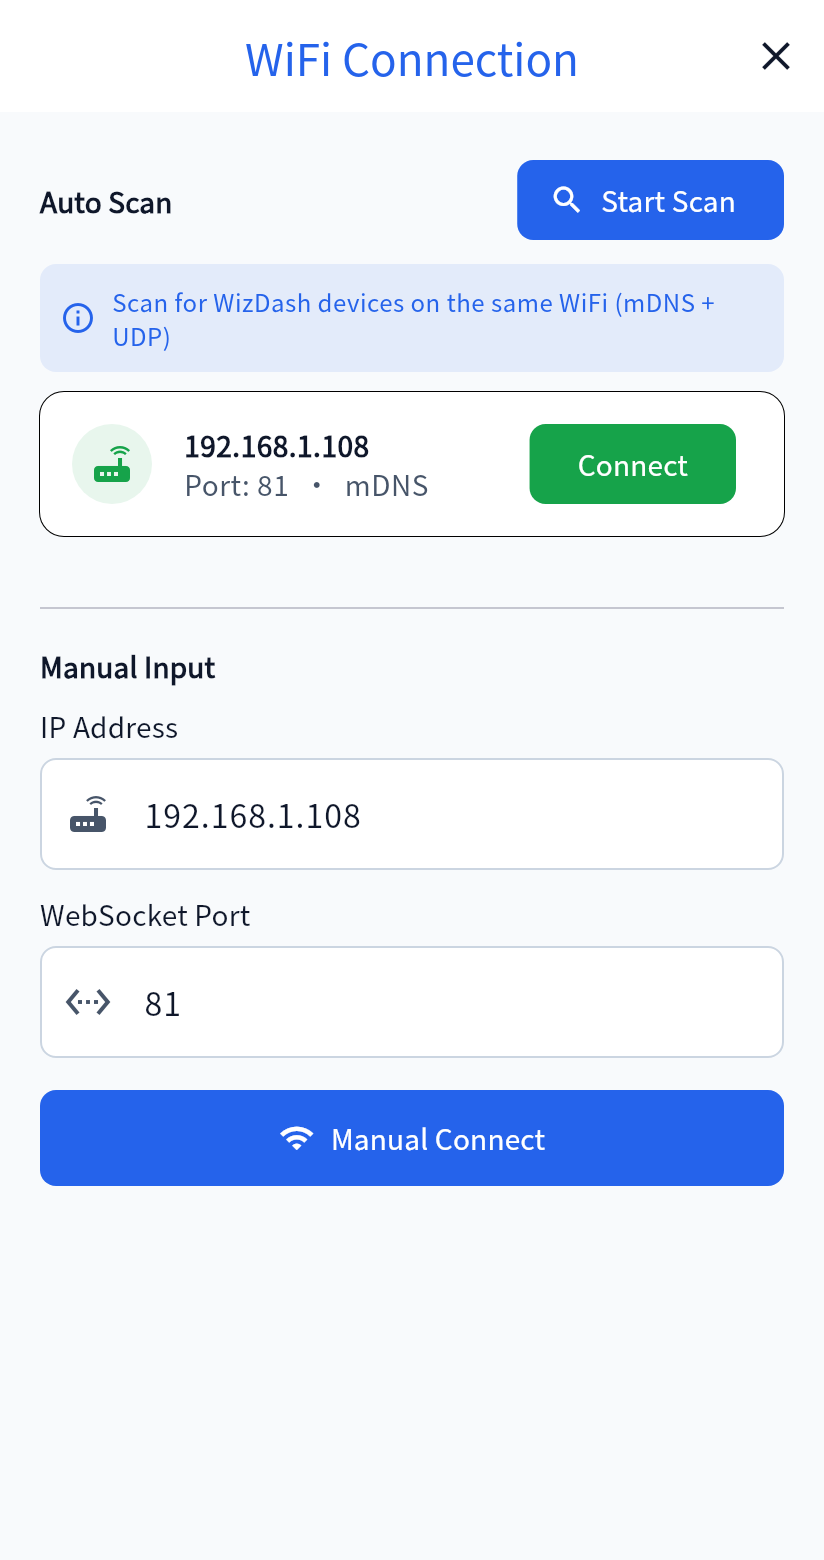
- In WizDash, tap “Options” → “Bind Device” on your project card (or tap “I’ve flashed firmware, connect device” on the unbound dashboard screen) to open the WiFi Connection screen:
- Auto Scan (mDNS + UDP): Tap “Start Scan”. When your ESP32 appears in the list (e.g.,
192.168.1.108,Port: 81 · mDNS), tap the green “Connect” button to complete device identification and return to finish binding. - Manual Input: If your router blocks local multicast/broadcast packets, type the IP address from Serial Monitor (
192.168.1.108) and port81under Manual Input and tap “Manual Connect”.
- Auto Scan (mDNS + UDP): Tap “Start Scan”. When your ESP32 appears in the list (e.g.,
- If you started binding from Projects, WizDash returns there after binding. Choose “Options” → “Enter Dashboard” to establish the ongoing connection. If you started from the unbound dashboard guide, WizDash returns to the dashboard and attempts to connect automatically.
Step 9: Watch Live Temperature & Humidity Data Arrive!
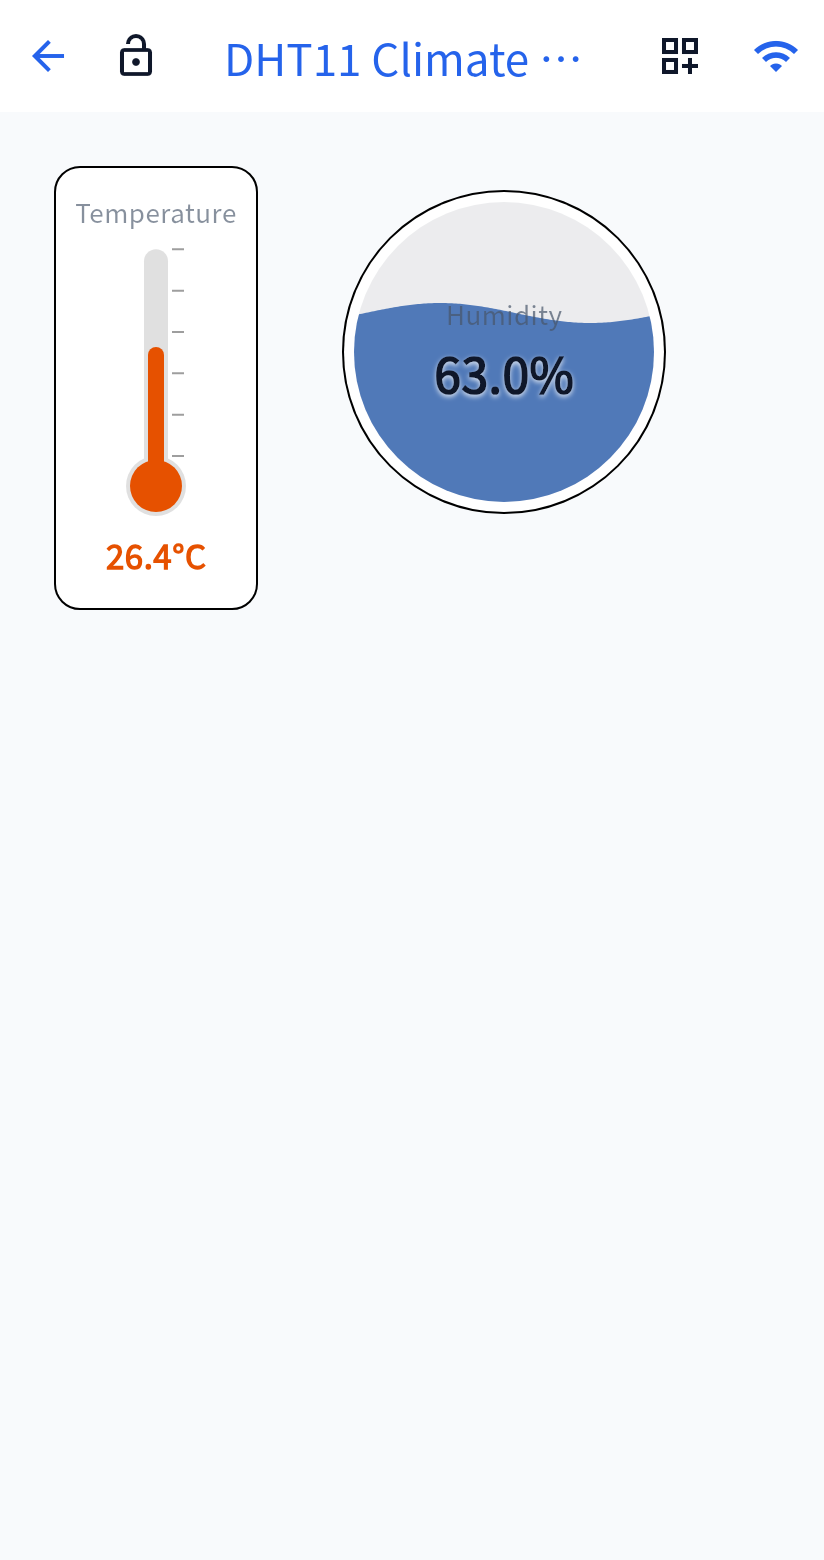
Section titled “Step 9: Watch Live Temperature & Humidity Data Arrive!”Once connected, the Wi-Fi icon in the top-right corner of the dashboard turns blue. Every 2 seconds, your ESP32 reads the DHT11 sensor and broadcasts {"temp": 26.4, "hum": 63.0} over WebSocket:
- The “Temperature” Thermometer on the left updates to
26.4°C. - The “Humidity” Ball on the right updates to
63.0%with a live animated wave.
Try breathing gently onto the blue DHT11 sensor housing—within 2 to 4 seconds you will see both the humidity wave ball and thermometer climb in real time!
Troubleshooting & Local Network Security Notes
Section titled “Troubleshooting & Local Network Security Notes”1. Serial Monitor prints [DHT11] Failed to read temperature or [DHT11] Failed to read humidity
Section titled “1. Serial Monitor prints [DHT11] Failed to read temperature or [DHT11] Failed to read humidity”This message appears when dht.readTemperature() or dht.readHumidity() returns NaN (no valid response from the sensor). Check the following:
- Pin silkscreen: Verify that the DHT11
DATAwire is connected to the pin labeledIO4/G4(GPIO 4) on your ESP32 board. - Power & ground: Confirm
VCCis connected to3V3andGNDtoGND, and that all jumper wires are seated firmly. - Missing pull-up resistor on 4-pin bare sensors: A bare 4-pin DHT11 without a PCB breakout requires a
4.7kΩ–10kΩresistor betweenVCC(Pin 1) andDATA(Pin 2).
2. Auto Scan finds nothing or Manual Connect fails
Section titled “2. Auto Scan finds nothing or Manual Connect fails”- Confirm your phone and ESP32 are on the exact same 2.4 GHz Wi-Fi subnet and that no VPN is active on your phone.
- Check Serial Monitor (
115200 baud) to verify the ESP32 printedIP: 192.168.x.x. If it keeps printing dots (.), double-check your 2.4 GHz Wi-Fi SSID and password.
3. Local Network & Sketch Sharing Security Notes
Section titled “3. Local Network & Sketch Sharing Security Notes”- Unencrypted LAN WebSocket (
ws://): Local Wi-Fi mode uses an unencrypted WebSocket (ws://<ESP32_IP>:81) intended for trusted home, lab, or classroom networks. For remote access across networks, use MQTT (Your Own Broker) with TLS encryption enabled (port8883). - Scrub credentials before sharing your
.inofile: The generated sketch embedsWIFI_SSIDandWIFI_PASSWORDin plaintext. Replace them with placeholders before committing the file to a public repository.